As an independent Accounting consultant, you are to prepare a financial analysis report of two companies, Hyatt and Starwood
Assignment Requirements
As an independent Accounting consultant, you are to prepare a financial analysis report of two companies, Hyatt and Starwood. Your report should cover all of the criteria listed below, demonstrating your understanding of the skills and techniques used to analyse financial reports. The report will make appropriate critical observations and recommendations for presentation to management. Refer to the most recent financial statements of the Company Annual Report.
Assignment Answers
Executive Summary
This report has analyzed and compared the financial position of two renowned hotels i.e. Hyatt hotels Corporation and Starwood hotels Corporation. The Operating results are deduced from observing financial trends, performing benchmark analysis and calculating financial ratios. It is found that Starwood is earning higher gross margin, operating margin, and generating more earning by using its assets and getting consistently higher amount of net income returned as a percentage of its shareholders equity. Whereas, Hyatt’s debts are rising and it has more chances of bankruptcy. Furthermore, the financial position analyzed from balance sheets revealed that Starwood has long-term survival, whereas, Hyatt ha short-term survival. Thus, it is recommended that Starwood is more favorable for investors since it has higher equity, generating more profits and can withstand longer during critical times. However, its current ratio value lags behind than that of Hyatt. It can be increased by paying down debts, acquiring loan, selling a fixed asset or putting profits back into the business (Business builder, n.d.). Moreover, it is recommended that investors also hold on Hyatt since it has strong core strategy with which it can expand well in more targeted segments. It can take advantage of its higher occupancy rate and can generate more RevPAR by expanding its properties globally.
Introduction
Hyatt hotels is a globally acknowledged company which is innovatively providing authentic hospitality to its world-wide customers for more than fifty years. Its core activities are based on running, contracting, possessing and developing branded Hyatt hotels, resorts, and suburban and vacation ownership properties worldwide (About Hyatt, 2014).
As of March 31, 2014, Hyatt hotels are geographically diversified, comprising of 554 properties, 8 brands, 275 full service hotels and 148,239 rooms (XNYS: H Hyatt hotels Corp, 2014). Its marketing strategy is based on increasing growth and revenues by enhancing performance of its hotels, and by expanding its brand image within attractive markets. Its current plans are based on getting strong capital base for being strategically flexible in investing, and expanding presence in 13 news markets such as Amsterdam, Hyatt Regency Mexico City and Grand Hyatt Kuala Lumpur etc. (Hyatt hotels, 2013).
On the other hand, Starwood Hotels is the global high-end company comprising of 1200 properties, 1180 hotels, 347285 rooms and nine brands namely, Regis, The Luxury Collection, W Hotels, Westin, Le Méridien, Sheraton, Four Points by Sheraton, and the lately launched Aloft and Element. Starwood Hotels’ marketing strategy is based on operating elite class luxury hotels only. Seeing this, it is currently planning to enhance its global footprint by 20% by 2019 via strategically targeting growth in the upper classy and luxury hotel market, and in key limited service sector (About us, 2014).
Review of Financial/Operating Results
In order to review and compare the financial results of both hotels, their income statements over the latest 3-year period i.e. 2011-2013 are considered here. The financial performances of Starwood and Hyatt hotels are reviewed via trend, ratio and industry benchmark analysis, as shown below:
Ratio analysis. Ratio analysis is mainly done, using financial statements, for examining the financial health of a business. This quantitative analysis is done by comparing the past and current performances. The sales, costs, expenses and profitability of the comparative businesses are shown here under using ratio analysis:
Firstly, consider the income statements of both Starwood and Hyatt hotels as shown below:
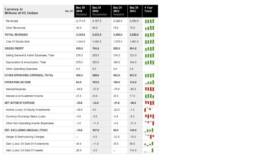
From above figure, the financial ratios of both Starwood and Hyatt hotels for period 2011-2013 are calculated to be:
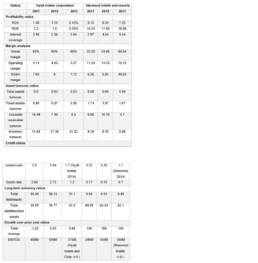
Now, from above presented ratios, let’s take each ratio one by one, compare the values of both businesses, and also compare with other hotels in industry. Firstly, ROA (return on asset) ratio is an indicator of how profitable a company is relative to its total assets. It can be seen that ROA shows an increasing trend individually for both Hyatt and Starwood. This shows that managements of both businesses are efficiently using their assets to generate earnings or revenues. However, in case of Starwood, ROA value is higher. This shows that Starwood is generating more earning by using its assets. From the table given below, it can also be seen that Hyatt is only above Accor w.r.t. generating revenues from its assets, whereas, Starwood holds the 3rd place in this regard and is showing average good performance.
ROE values shows abrupt trend in case of Hyatt hotel. The value declines in 2012 but increases a lot in 2013. It is due to the fact the Hyatt faced recession in terms of generating profit with the money shareholders have invested, but covered it up the very next year. Whereas, in case of Starwood, it is higher comparatively and increases gradually. This shows that Starwood is getting consistently higher amount of net income returned as a percentage of its shareholders equity. From the table given below, it can also be seen Hyatt and Starwood are competing each other, showing good performances in industry, where Hyatt stands 3rd, lagging behind Starwood which stands 2nd in the market place.
The interest coverage ratio is a measure of the number of times a company could make the interest payments on its debt with its earnings before interest and taxes, also known as EBIT. It can be seen that Starwood is acquiring higher value of interest coverage ratios as compared to Hyatt. It is due to the fact that liquidity ratios’ values are lower in case of Hyatt comparatively. As a result, its debts are rising and Hyatt has more chances of bankruptcy.
Gross margin reveals the amount that an entity earns from the sale of its products and services, before the deduction of any selling and administrative expenses. It can be seen that its values remains constant for 3 years for Hyatt, whereas increases gradually up to 68% for Starwood. This shows that Hyatt is continuously earning gross profit which is covering its selling and administrative expenditures. However, Starwood has surpassed it by the end of 2013 by being more competitive in terms of its services etc. From the table given below, it can be seen that Hyatt is below average in terms of gross margin value, whereas Starwood is showing good average performance by securing 2nd position in the market.
Operating margin measures the operating efficiency of a business. It can be seen that its value is comparatively higher in case of Starwood than Hyatt. It is due to the fact that Starwood is better able to pay for its fixed costs, such as interest on debt.
SG&A ratio is the sum of all direct and indirect selling expenses and all general and administrative expenses of a company. Its value fluctuates in case of Hyatt and declines by the end of 2013, whereas it is lot higher comparatively in case of Starwood. This shows that Starwood is facing serious problems of high SG&A expenses. Whereas, Hyatt is not wasting valuable cash flow, and is attempting to keep its SG&A expenses under tight control and limited to a certain percentage of revenue by reducing corporate overhead.
Next, in case of total assets turnover ratio, the values are comparatively higher in case of Starwood. It is due to the fact that it is using its assets more efficiently to generate more revenues. Furthermore, in case of fixed asset turnover ratio, the values are again comparatively higher in case of Starwood. It is due to the fact that Starwood is efficient at managing its fixed assets.
Likewise, in case of Accounts receivable turnover ratio, the values fluctuates but rises by 2013 for Hyatt, whereas, Starwood shows decline in the value by the end of 2013. This reveals that Hyatt is effectively managing the credit that it is extending to its visitors, consumers and owners. From the table given below, it can be seen that the values of this ratio is maximum for Accor, minimum for Intercontinental, whereas Hyatt stands below Starwood which secures 3rd position.
Conclusions, Observations and Recommendations
By considering the above assessments, financial results and positions of both Hyatt and Starwood hotels, following outcomes were observed and concluded:
- Starwood is more geographically diversified with greater number of hotels, rooms and brands. As a result, it has higher room rates and RevPAR values, showing that it is earning more revenue per day from each of its hotel rooms.
- Hyatt earns comparatively more annual revenues by targeting more markets. This shows it has strong marketing strategy in hospitality industry.
- Starwood strategy is weak since it plans to target key limited service sector and upper class segment only, whereas, Hyatt is planning to expand 13 news attractive markets.
- Hyatt has higher liquidity ratio values, showing it is better able to meet its short-term obligations. However, it lower values in 2011 shows that it faced recession in that period.
- Starwood has higher solvency ratios values, showing it is better able to meet its long-term debts i.e. it has long-term survival.
- Starwood has higher values of profitability ratios, showing it is more able to earn an adequate return relative to sales or resources devoted to operations.
Here, it is concluded that Starwood is ahead of Hyatt w.r.t. more geographical diversification, and higher values of solvency and profitability ratios. This shows it is expanding it is earning more profits and has long-term survival. Whereas, even though Hyatt has strong strategy and plans to target more segments, still is has lower RevPAR values. Moreover, even though it has higher liquidity, but its short-term survival lags behind than long-term survival of Starwood in the industry.
So, it is recommended that Starwood is more favorable for investors since it has higher equity, generating more profits and can withstand longer during critical times. However, its current ratio value lags behind than that of Hyatt. It can be increased by paying down debts, acquiring loan, selling a fixed asset or putting profits back into the business (Business builder, n.d.).
Moreover, it is recommended that investors also hold on Hyatt since it has strong core strategy with which it can expand well in more targeted segments. It can take advantage of its higher occupancy rate and can generate more RevPAR by expanding its properties globally.
References
About Hyatt. (2014). Hyatt. Retrieved from: http://www.hyatt.com/hyatt/about/index.jsp;jsessionid=041D17FE6FFAB6BF6724AFAE95B45154.atg07-prd-atg2?type=clear
About us. (2014). Starwood hotels and resorts. Retrieved from: http://development.starwoodhotels.com/about/
Annual financial report. (2014). Accor. Retrieved from: http://www.accor.com/en/finance/financial-library/regulated-information/annual-financial-report.html
Bajkowski, J. (1999, January). Financial statement analysis: A look at the balance sheet. AAII journal. Pp. 7-10. Retrieved from: http://www.aaii.com/journal/article/financial-statement-analysis-a-look-at-the-balance-sheet
Benchmarking analysis. (2014). United States postal service. Retrieved from: https://about.usps.com/manuals/spp/html/spp1_043.htm
Business builder 2. (n.d.). Zions bank. Retrieved from: https://www.zionsbank.com/pdfs/biz_resources_book-2.pdf
Usman, H. M. (n.d.). Definitions and formulas related to ratio analysis. VUZS. Retrieved from: http://www.vuzs.net/extra-notes/44-fin630-investment-analysis-a-portfolio-management/5130-definitions-and-formulas-related-to-ratios-analysis.html
Financial library. (2014). IHG. Retrieved from: http://www.ihgplc.com/index.asp?pageid=56&data=Reports
Financial reports – annual. (2014). Marriott. Retrieved from: http://investor.shareholder.com/mar/reports.cfm
Hyatt hotels Corp – CI A (H: New York). (2014). Bloomberg BusinessWeek. Retrieved from: http://investing.businessweek.com/research/stocks/financials/ratios.asp?ticker=H
Hyatt hotels Corp H. (2014). Morning star. Retrieved from: http://financials.morningstar.com/ratios/r.html?t=H
Revenue per available room (RevPAR). (2014). Investing answers. Retrieved from: http://www.investinganswers.com/financial-dictionary/ratio-analysis/revenue-available-room-revpar-807
Select-service owners, investors say outlook favorable. (2010, March 31). Hotel news now. Retrieved from: http://www.hotelnewsnow.com/article/PrintVersion/3051/
Starwood hotels and resorts (HOT: New York). (2014). Bloomberg BusinessWeek. Retrieved from: http://investing.businessweek.com/research/stocks/financials/ratios.asp?ticker=HOT
Starwood hotels and resorts worldwide Inc. (2014). Morning star. Retrieved from: http://financials.morningstar.com/ratios/r.html?t=HOT
XNYS: H Hyatt hotels Corp quarterly report. (2014, March 31). Morning star. Retrieved from: http://quote.morningstar.com/stock-filing/Quarterly-Report/2014/3/31/t.aspx?t=XNYS:H&ft=10-Q&d=4f6cc4d523e5ef39382dddf36e305ca2